


Executives love dashboards for good reason: they provide timely and easy-to-understand updates on project activities. With dashboards, stakeholders can gain a high-level understanding of how the project is performing and make any necessary adjustments.
But despite their usefulness, dashboards have their limitations. Although they are able to convey snapshots of important project KPIs, they lack the nuance and context that is needed to make data-driven decisions.
Dashboards aren’t dead, but there are problems that dashboards alone can’t solve.
Problems With Analytics Dashboards
Relying too much on dashboards as a source of truth can be detrimental to your project and its stakeholders.
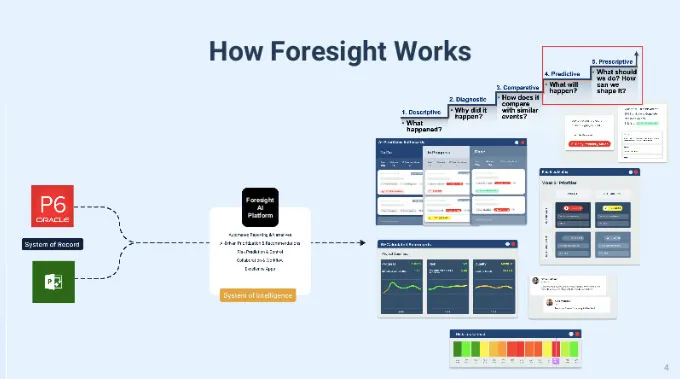
Data analytics should do 3 things:
- Describe existing or past phenomena
- Predict future events based on past data
- Prescribe a course of action
But most dashboards only cover the first aspect – describing what has already happened – sufficiently. Project teams also need to predict what will happen next in order to take the right actions, and that requires:
- Knowledge of how the data was generated
- Understanding of the business context
- Exceptional critical thinking skills to interpret the data
The same things that make dashboards useful are also the same things that make them dangerous. Their simplicity and visual appeal can lead to poor decision making by omitting the context and nuances of the data being used.
But the issue isn’t only about the dashboards themselves; it is also about how we are using them. Relying solely on dashboards to measure project performance is problematic for the following reasons:
1. Data is out of date
Project dashboards take time to develop and update. It often requires a trained data scientist or data analyst to interpret and prepare the data, as well. This means that by the time the data reaches the dashboard, it is already out of date.
But project teams need to make data-driven decisions in real time. They don’t have days or weeks to react to changes and delays that affect critical tasks.
To put it simply, dashboards are a great way to review and analyze historical data, but they do not always reflect the current state of the project. Issues such as resource constraints, changing requirements, and schedule deviations are often not measured or displayed in project analytics. Therefore dashboards should not be used to make predictions or prescribe a course of action.
2. Critical Tasks Can Change
Project dashboards are often built on assumptions about what’s important to the project’s timeline. The problem is that KPIs and critical paths can change throughout the lifespan of a project.
If your dashboard is focused mainly on tracking progress on critical activities, you are not getting an accurate view of the project’s current status. Priorities can change and what was important to track at the beginning may not be what’s important at the middle or end of the project.
Even the most reliable dashboards have blind spots that can leave a project vulnerable to unexpected deviations and cost overruns.
3. Too much data is left unseen
According to a 2020 report by Seagate Technology, 68% of data available to businesses goes unleveraged. The reason? There is simply too much.
Megaproject teams wittingly or unwittingly collect more information than they use. Scheduling tools such as Primavera P6 or MS-Project are used to amass huge amounts of data – more data than humans could possibly digest. In fact, managing and storing all that information is a challenge in and of itself, let alone making it usable.
How Predictive Analytics Can Improve Project Dashboards
Relying on dashboards alone can create a lot of blindspots for project teams. Using predictive analytics to enhance your project data can help your team answer the following questions:
- What is the probability of schedule delay on a milestone or project?
- What are the most important activities or milestones that could potentially impact the overall project completion date?
- How accurate are the estimated durations for individual activities or inter-milestones?
- What is the probability of finishing the project on time, given the current planned project completion?
- What activities or milestones are at risk of being delayed or missed, and what are the potential consequences of those delays?
- How can the schedule be optimized to reduce overall project duration, without compromising quality or increasing risk?
- What are the most effective ways to allocate resources across multiple projects in order to minimize delays and optimize portfolio outcomes?
- How can past project performance data be used to improve the accuracy of future project schedules?
- What are the key early warnings that could generate surprises, and how can they be addressed in order to predict and prevent surprises?
- How can schedule data be used to improve collaboration and communication among project team members, stakeholders, and other stakeholders involved in the project?
How Prescriptive Analytics Can Improve Project Dashboards
Using prescriptive analytics to enhance your project data can help your team answer the following questions:
- What schedule quality logic checks should be implemented to ensure the accuracy and reliability of the project schedule?
- What are the recommended actions to improve the quality of the project schedule?
- What are the best ways to mitigate potential schedule risks and delays?
- What are the best ways to optimize the activities sequence and/or critical activities to improve project performance?
- What are the best practices for ensuring that the schedule is communicated effectively to stakeholders and team members?
- How can the project team allocate or optimize resource allocation to improve schedule performance?
By incorporating prescriptive analytics, teams can also:
- Prescribe a delay recovery action plan
- Based on Reference Class Forecasting, prescribe appropriate levels of contingency at the activities and overall project levels.
- Prescribe an ambitious but realistic and achievable path to project completion, given the available resources and constraints?
- Prescribe potential opportunities that could help to compress over all duration?
Enhance Your Dashboards Using AI-based Narratives
So where does all this leave dashboards? They are simply another tool at your disposal to manage and interpret megaproject performance.
Dashboards shouldn’t be abandoned, but they also shouldn’t be the only way that data is accessed. Adding a system of intelligence like Foresight to your technology stack can help you overcome the current gaps in megaproject reporting and give your stakeholders access to up-to-date project information throughout the duration of the program.
Contact us or download your free white paper to learn how Foresight works with your existing project management software to provide robust insights and task management.