



How Schedule Maturity and Process Transparency Can Earn Data Centers Their Social License to Build
Dr. Atif Ansar and Simon Allen
Dr. Ansar is Co-Founder and Executive Chairman of Foresight and holds positions at the University of Oxford’s Saïd Business School and Smith School. Simon Allen is a Senior Strategic Advisor at Foresight.
The thesis
The data center industry is engaged in one of the largest infrastructure buildouts in modern history. Goldman Sachs projects hyperscale capital expenditures of $1.4 trillion between 2025 and 2027. Moody’s Ratings expects the six largest U.S. hyperscalers alone to spend $700 billion in 2026, nearly six times their 2022 level. The computational infrastructure that will underpin the AI era must be built somewhere, by someone, and soon.
Yet the industry faces a growing trust gap with the communities in which it needs to build. Sightline Climate’s 2026 Data Center Outlook, tracking 777 hyperscale projects exceeding 50 MW announced since January 2024, found that 30% to 50% of the 16 GW of capacity planned for 2026 is expected to be delayed or cancelled. Only 5 GW is currently under construction. Community opposition is now a material factor in project attrition, with 25 data center projects cancelled due to local resistance in 2025 alone (Heatmap News, January 2026).
The context in which these projects are being developed is also changing rapidly. Media coverage of data centers has increased sharply in recent years, reflecting growing public and political attention. Analysis of Financial Times coverage suggests that annual mentions of “data centers” have increased from fewer than 100 articles in 2022 to several hundred in 2025, with further growth expected.
Public awareness is not static; it is accelerating. As visibility increases, so too does scrutiny, raising expectations around transparency, credibility, accountability, and local impact.
This paper argues that the trust gap is closable, and that the mechanism for closing it is already available to the industry. The organizational maturity and strategic governance required to deliver complex capital projects on time, specifically the disciplines of honest forecasting, transparent schedule management, and data-driven progress reporting, are the same capabilities that demonstrate to communities that a developer is a credible, accountable long-term partner. In our experience working with some of the world’s most complex capital programs, the projects that earn community consent are those whose sponsors can make commitments grounded in evidence rather than aspiration, and who possess the operational machinery to keep them.
Too often, engagement with local communities begins late in the planning process, when positions are already entrenched and dialogue becomes reactive. The most effective developers engage earlier, identifying the stakeholders who shape local opinion, building relationships before plans are finalized, and demonstrating tangible value to the communities they seek to serve.
In this sense, trust is not a function of communication alone, but of timing, capability, and credibility.
Communities do not want to stop progress. They want to distinguish between developers who will deliver on their promises and those who will not. Schedule maturity is how developers make that distinction visible.
The scale of the opportunity and the trust gap
The demand signal is unambiguous. U.S. data center electricity demand is projected to rise from 62 GW in 2025 to 134 GW by 2030 (S&P Global/451 Research). Gartner projects worldwide data center electricity consumption will roughly double from 448 TWh in 2025 to 980 TWh by 2030. The IEA models U.S. data center electricity consumption rising from 183 TWh in 2024 to nearly 400 TWh by 2029. These are facilities that bring with them significant capital investment, employment during construction and operations, tax revenue, and long-term economic activity for the communities that host them.
The challenge is that a gap has opened between the pace of announcement and the pace of credible delivery. In 2025, 26% of 110 projects expected to come online were delayed, with timelines spilling into 2026 (Sightline Climate, 2026). Of the 16 GW planned for 2026, 11 GW remains at the “announced” stage with no visible construction progress, despite typical build timelines of 12 to 18 months. Peter Freed, Meta’s former director of energy strategy, has estimated that only around 10% of currently planned projects will result in finished facilities.
The gap between announcement and delivery creates a trust problem that manifests in polling data. A Pew Research Center survey of 8,512 U.S. adults in January 2026 found that 39% of respondents believe data centers negatively affect the environment (versus 4% positive), 38% say they drive up household energy costs (versus 6%), and 30% believe they diminish quality of life for nearby residents. A Heatmap/Embold Research poll of 3,741 registered voters in August 2025 found that only 44% would welcome a data center nearby. These perceptions are not yet entrenched; importantly, the Pew study also found that a significant proportion of respondents remain neutral or undecided on many dimensions. This is a window of opportunity, not a closed door.
Recent signals from the market
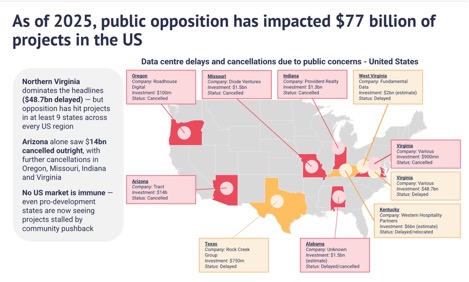
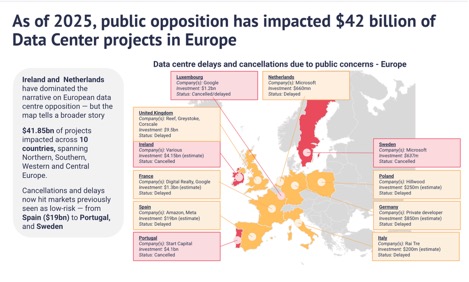
Recent project experience illustrates how community resistance is already translating into material delivery impact. These are not isolated incidents, but early indicators of a broader structural shift in how projects are evaluated, challenged, and ultimately delivered.
What megaproject research tells us about this pattern
The pattern playing out in the data center sector is well documented in the broader infrastructure literature. In a study of major capital projects spanning 104 countries and six continents, Flyvbjerg (2014) found that nine out of ten experience cost overruns, with overruns of up to 50% in real terms common and above 50% not uncommon. The pattern has held steady across the 90-year period for which comparable data exist. McKinsey’s analysis of the same body of evidence found that rail projects experience average cost overruns of 44.7% combined with average demand shortfalls of 51.4% (McKinsey, 2015). In our own research on large hydropower dams, the largest reference class study of its kind, we found “overwhelming evidence that budgets are systematically biased below actual costs” and that dams “take inordinately long periods of time to build” (Ansar, Flyvbjerg, Budzier, and Lunn, “Should We Build More Large Dams? The Actual Costs of Hydropower Megaproject Development,” Energy Policy, vol. 69, 2014, pp. 43–56). For dams, average schedule overruns reach 45%, meaning a project planned for ten years typically takes fourteen and a half.
Two drivers explain the bulk of this underperformance: optimism bias, the unconscious tendency to underestimate costs, timelines, and risks while overestimating benefits; and strategic misrepresentation, the deliberate shading of forecasts to secure approval (Flyvbjerg, Bruzelius, and Rothengatter, Megaprojects and Risk, Cambridge University Press, 2003). Critically, the research also shows that overrun is principally a consequence of upstream underestimation, “happening upstream from overrun, for big projects often years before overruns manifest” (Flyvbjerg, Project Management Journal, 2021). In a companion study, we demonstrated that this dynamic extends beyond individual projects to the macroeconomic level: over half of infrastructure investments in China over three decades destroyed rather than generated economic value, largely due to systematically biased cost and benefit forecasts (Ansar, Flyvbjerg, Budzier, and Lunn, “Does Infrastructure Investment Lead to Economic Growth or Economic Fragility? Evidence from China,” Oxford Review of Economic Policy, vol. 32, no. 3, 2016, pp. 360–390).
The concept of fragility is relevant here. In our chapter for The Oxford Handbook of Megaproject Management, we characterized the propensity of large capital investments to deliver poor outcomes as “fragility,” building on Nassim Taleb’s framework. Contrary to their appearance, big capital investments break easily, “crushed under the weight of their sunk costs” due to the various sources of uncertainty that accumulate during their long gestation, implementation, and operation periods (Ansar, Flyvbjerg, Budzier, and Lunn, “Big Is Fragile: An Attempt at Theorizing Scale,” in Flyvbjerg, ed., The Oxford Handbook of Megaproject Management, Oxford University Press, 2017, ch. 4, pp. 60–95).
None of this is inevitable. These are problems of practice, not physics. The same body of research that diagnoses the pathology also prescribes the remedy: reference class forecasting, empirically grounded risk quantification, and institutional incentive alignment. The industry has both the resources and the sophistication to apply these disciplines at scale.
Why process maturity and social license are structurally linked
The central argument of this paper is that the organizational capabilities required to deliver projects on schedule are not separate from the capabilities that win community trust. They are the same thing, observed from different vantage points.
Consider what it takes for a developer to credibly commit to a community that construction will last 22 months and that disruption will remain within defined bounds. The developer must possess an honest, empirically anchored schedule rather than an aspirational one. It must have the analytical infrastructure to track progress against that schedule in real time: critical path analysis, float consumption monitoring, productivity trending, predictive forecasting. It must have a culture that surfaces problems early rather than burying them. And it must have governance structures that connect the team making the commitments to the team executing the work.
These are not community relations capabilities. They are project delivery capabilities. But their presence or absence is legible to any stakeholder paying attention. A developer that produces a credible, data-informed construction timeline, and then reports transparently against it, is demonstrating the same organizational discipline that will actually deliver the project on time. A developer that cannot produce such a timeline, or that treats its schedule as a political document rather than an operational tool, will inevitably break its promises to the community, not out of bad faith, but because it lacks the machinery to keep them.
The community, in this framing, is exercising a form of reference class forecasting of its own. Residents may not use the terminology, but they are asking the right question: given what we know about how infrastructure projects typically perform, how confident should we be that this developer will do what it says? The developers who earn trust will be those who can answer that question with evidence rather than assurance.
The data center community benefit agreement as a maturity test
Lancaster, Pennsylvania illustrates both the potential and the demands of this approach. When Chirisa Technology Parks proposed two data center campuses with a combined $10 billion construction cost, the city negotiated a community benefit agreement with hard, quantified commitments: water usage capped at 20,000 gallons per day per campus with closed-loop cooling, noise and air quality standards, 100% clean energy procurement, and $20 million in contributions to economic development and sustainability funds. The agreement also required the developer to maintain a public website posting construction timelines and progress information (City of Lancaster CBA, November 2025).
Brookings, in a January 2026 analysis, noted that Lancaster’s approach represents a potential model for data center-specific community benefit agreements that incorporate measurable environmental and economic commitments going beyond standard zoning provisions. The structure illustrates the principle: measurable commitments, tied to specific milestones, with transparency mechanisms allowing the community to verify compliance.
The lesson for the industry is not that every project needs to replicate Lancaster’s exact template. It is that the kind of specificity, transparency, and accountability that communities increasingly demand is only possible for organizations that possess mature delivery processes. You cannot commit to a construction timeline with confidence if you do not have the analytical tools to produce a reliable one. You cannot report progress transparently if you do not have the systems to track it. The community benefit agreement is, in effect, a maturity test.
The financial case for process transparency
The financial logic is straightforward. With $700 billion in hyperscale capex committed for 2026 (Moody’s Ratings), the delay or cancellation of even a fraction of associated projects represents tens of billions in stranded capital, unrealized revenue, and compounding costs. In Georgia alone, 6 GW of large-load projects were cancelled in just three months ending September 2025. Sightline Climate’s analyst Olivia Wang has observed that community resistance is “now a true material driver of attrition” in the development pipeline.
The investment required to build the schedule intelligence and community transparency capabilities described here is trivial relative to the capital at risk. For a $2 billion data center campus, the incremental cost of predictive schedule analytics, structured progress reporting, and evidence-based community engagement represents a fraction of a percent of total project cost. It is not an added expense. It is insurance against the largest and fastest-growing source of project attrition in the sector.
The developers who will build successfully in the coming decade are those who understand this arithmetic. The industry does not have a community problem. It has a credibility problem. And credibility is a function of process maturity.
A constructive path forward
Data centers bring genuine economic value to their host communities: construction employment, permanent operations jobs, tax revenue, and the infrastructure that underpins the digital economy. The challenge is not to justify this value in the abstract but to make it tangible, specific, and trustworthy at the local level.
This requires the industry to invest in four capabilities:
First, honest scheduling. Applying reference class forecasting and empirical benchmarking rather than aspirational timelines. In our research, we have shown that parsimonious statistical models fitted with only a few variables known ex ante can predict cost and schedule overruns with useful accuracy (Ansar et al., Energy Policy, 2014). The tools exist. The question is whether developers have the institutional incentive and discipline to use them.
Second, transparent progress reporting. Establishing mechanisms, whether through community benefit agreements, public dashboards, or regular stakeholder briefings, that allow communities to verify claims against reality. This does not require disclosing commercially sensitive information. It requires sharing the kind of schedule and progress data that any well-managed project should already be producing for its own governance purposes.
Third, early and evidence-based engagement. Meeting communities with data rather than renderings. Showing what the construction process will look like, how long it will take, what the disruptions will be, and how they will be managed, grounded in empirical evidence from comparable projects rather than best-case assumptions.
Fourth, institutional accountability. Connecting the people making commitments to communities with the people managing project delivery, so that promises are anchored in operational reality rather than detached from it.
These are not radical propositions. They are the standard practices of mature capital delivery organizations, from energy utilities to transportation authorities to defense programs. The data center sector, which is deploying more capital more rapidly than almost any infrastructure sector in history, has every reason and every resource to adopt them.
The trust gap is real, but it is closable. Communities are not opposed to the data center build-out. They are waiting to see which developers will approach them not as obstacles to be managed, but as long-term partners who merit the same rigor, transparency, and respect that the industry brings to its engineering and its finance. The organizational maturity that delivers projects on time is the same maturity that earns the license to build. The industry has the opportunity to demonstrate both.
References
Ansar, A., Flyvbjerg, B., Budzier, A. and Lunn, D. (2014) ‘Should We Build More Large Dams? The Actual Costs of Hydropower Megaproject Development,’ Energy Policy, 69, pp. 43–56.
Ansar, A., Flyvbjerg, B., Budzier, A. and Lunn, D. (2016) ‘Does Infrastructure Investment Lead to Economic Growth or Economic Fragility? Evidence from China,’ Oxford Review of Economic Policy, 32(3), pp. 360–390.
Ansar, A., Flyvbjerg, B., Budzier, A. and Lunn, D. (2017) ‘Big Is Fragile: An Attempt at Theorizing Scale,’ in Flyvbjerg, B. (ed.) The Oxford Handbook of Megaproject Management. Oxford: Oxford University Press, ch. 4, pp. 60–95.
Flyvbjerg, B. (2014) ‘What You Should Know About Megaprojects and Why: An Overview,’ Project Management Journal, 45(2), pp. 6–19.
Flyvbjerg, B., Bruzelius, N. and Rothengatter, W. (2003) Megaprojects and Risk: An Anatomy of Ambition. Cambridge: Cambridge University Press.
Gartner (2025) ‘Electricity Demand for Data Centers to Grow 16% in 2025 and Double by 2030,’ Press Release, 17 November.
Goldman Sachs Global Investment Research (2025) ‘AI to Drive 165% Increase in Data Center Power Demand by 2030,’ February.
Heatmap News (2026) ‘Data Center Watch: 2025 Year in Review,’ January.
McKinsey & Company (2015) ‘Megaprojects: The Good, the Bad, and the Better,’ July.
Moody’s Ratings (2026) ‘Tech Giants’ Capital Spending Surging to $700 Billion Amid Robust AI Demand,’ March.
Pew Research Center (2026) ‘Americans’ Views of Data Centers,’ Survey of 8,512 U.S. Adults, January.
S&P Global / 451 Research (2025) ‘Data Center Grid-Power Demand to Rise 22% in 2025, Nearly Triple by 2030,’ October.
Sightline Climate (2026) ‘Data Center Outlook: 2026 Pi